If you’ve read any coverage of the property market recently, you may be forgiven for thinking we’re on the brink of disaster and the property price bubble is about to go boom. Fortunately, the reality may not be nearly as grim as a lot of commentators would have you believe.
The property cycle is more a clock, than a time bomb, and there are opportunities available at all hours on the clock for savvy investors who can keep their cool and adjust their investment strategies. Understanding the property cycle as you would a clock with set points to watch, buy and sell is often considered the golden ticket to property investment success.
In the property-cycle, yields are typically strong across the bottom of the cycle and capital growth strong across the top. Therefore, it is a logical decision to buy property when the housing cycle is at the bottom of a downturn and sell when it is reaching the peak. The trick is identifying where particular markets and sectors sit within the property cycle.
Phases of the clock
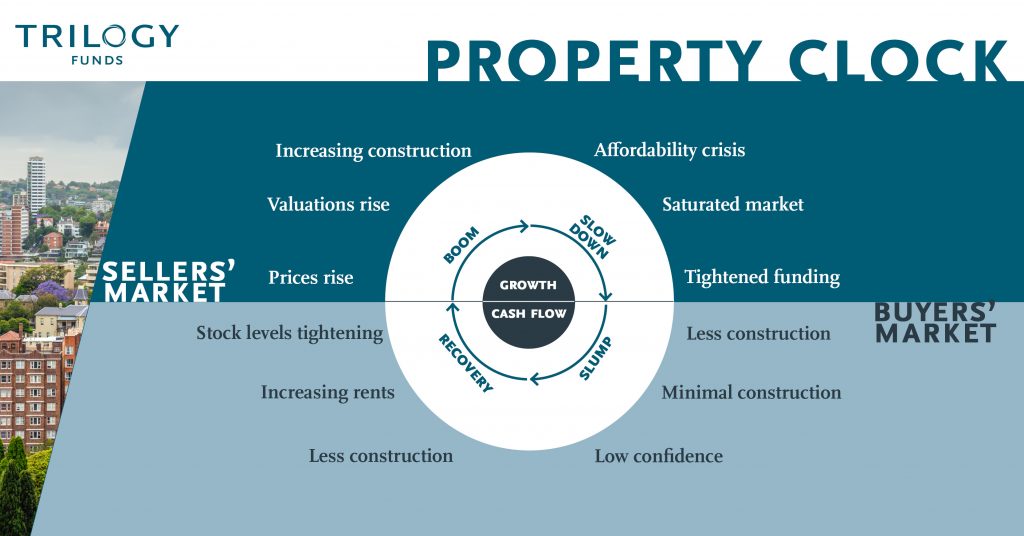
The property-cycle has four phases – the value stage (slump), the growth phase (recovery), the peak (boom), and the correction (slow down). The whole cycle typically takes seven to ten years. Typically, you’ll see two to three years of robust growth followed by seven to eight years of slow to moderate growth. However, there are many factors to consider which drive the property cycle – most of which are recurring – such as liquidity, economic growth, consumer confidence, investment returns, scarcity of supply and rising demand.
At the bottom of the market, rental yields are strong, and the confidence in the market is quite low. These characteristics provide investors with five to seven-year investment goals and the opportunity to take advantage of strong yields, while waiting for the property increase in capital value. At the peak – also known as the “seller’s market” – rental yields are weak and confidence is high. This commonly results in more buyers than sellers, providing those investors who purchased at the bottom of the cycle a healthy market in which to sell.
A popular misconception is that there is one Australian property market, but the reality is far different. The residential markets in Sydney and Melbourne are far different from those in Brisbane and Perth. Further, industrial, commercial, retail and hospitality asset classes are different yet again.
Based on the principals of the property clock and market research released by CoreLogic RP Data, Savills and Colliers International, there are currently several potential opportunities across the hours.
Industrial property across the Eastern Seaboard potentially sits within the opportunistic ‘buy’ period. According to Colliers International’s Research and Forecast Report: Industrial Second Half 2017, the next six months should see yields within the Eastern Seaboard states remaining constant. Major infrastructure projects, long-term leases (typically backed by multinational corporations), and a diversified source of investment capital will potentially support Long-run growth in industrial property values (land, capital, and rent) across this region.
Consistent with the relatively high economic growth of Sydney and Melbourne, conditions remain strongest in these industrial markets. However, Queensland’s SFD (state final demand) experienced positive growth for the second year running, with annual growth of 2.8% in 2017. Given Queensland and industrial property’s link to the mining sector, this outcome is not surprising. Indeed, profits for industrial companies linked to mining grew by 59% in the 12 months to June 2017.
Moving around the clock, approaching the sellers’ market is commercial office in Sydney’s Central Business District (CBD). However, with a vacancy rate of just 5.9% at the end of July 2017, there appear to be no signs of CBD commercial demand faltering in the nation’s largest city.
Approaching the top of the market is Hobart’s residential property. The Apple Isle’s capital saw residential values increase by 1.71% in September. This is easily the best performance of any capital city market complementing its 14.30% rise over the past year. Owners of Hobart houses had even more to smile about, with an increase of 2.12% in the September quarter and 15.05% over the past twelve months. The question is – can Hobart beat Sydney residential’s long run across the top of the clock?
Getting it right
Unfortunately, emotions may often dictate investment decisions. During the boom period, people often buy due to the fear of missing out. People also frequently make the opposite mistake and resist buying at the bottom of the cycle because they think the property market is underperforming. So, while market commentators can estimate where properties sit on the clock, emotional investors may sometimes cause a wrinkle in time.
Every Australian region and property sector sits at a different point on the property clock. If investors can remove emotion from purchase decisions then when one location or sector is overheating, there is invariably another sector or asset class ready to meet their goal of yield or capital growth.